
Adam McCann, WalletHub Financial Writer
Originally published July 22, 2026 by WalletHub
Where a young American grows up shapes how well they make the crossing into adult life. A 2026 study by WalletHub compared all fifty states and the District of Columbia across fifteen indicators of youth risk — from the share of young people neither working nor in school, to youth poverty, homelessness, drug use and high-school completion — and scored each place out of 100.
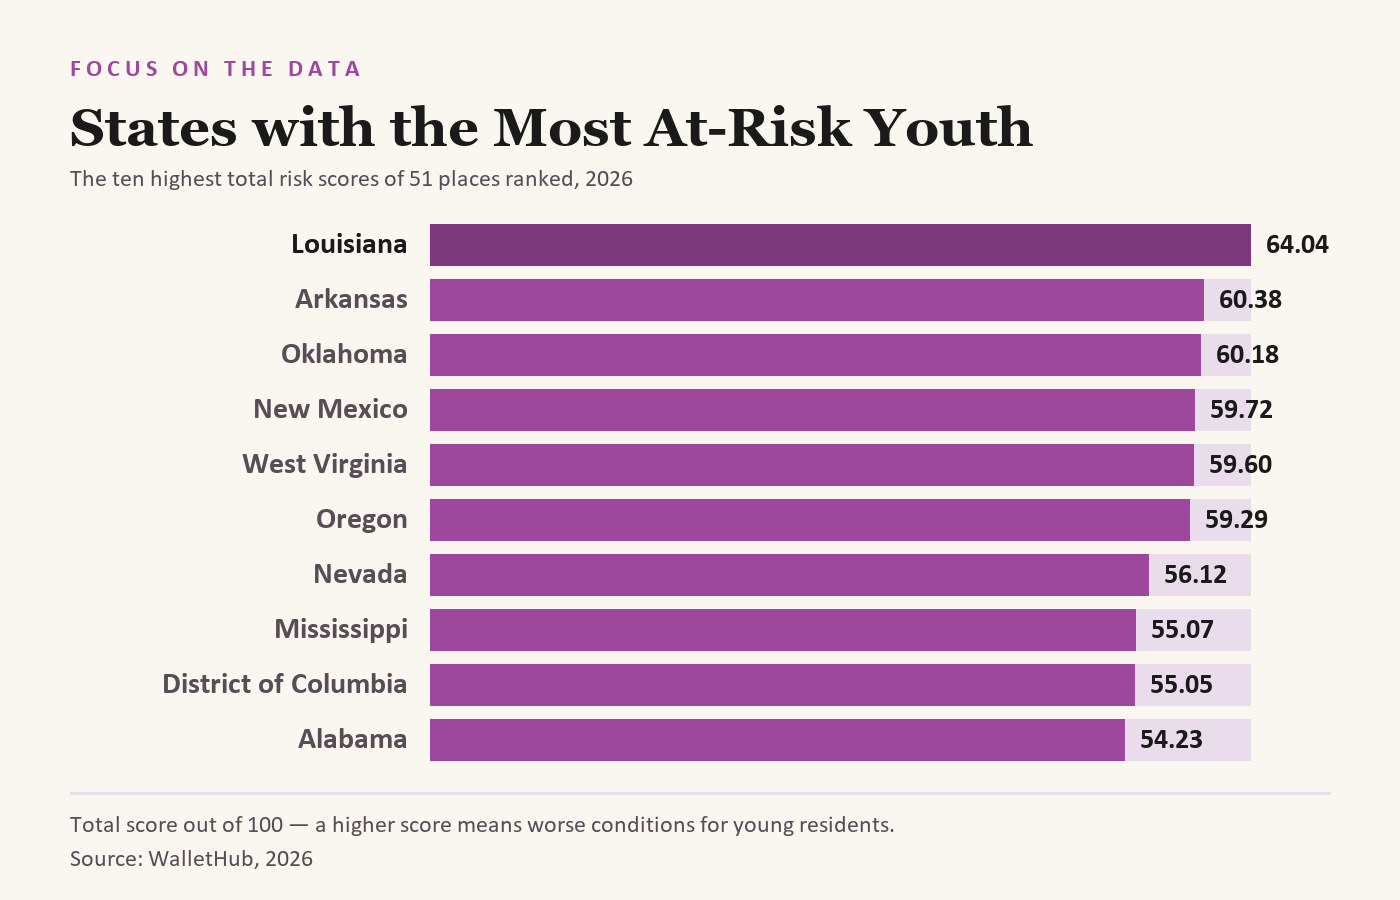
Louisiana ranks as the state with the most at-risk youth, followed by Arkansas and Oklahoma. New Jersey sits at the other end of the table. A higher total score means worse conditions for young residents, and in the two category columns a rank of 1 likewise marks the worst conditions, not the best.
“A high share of youth who are not working, not getting education and generally stagnating in life can spell trouble for the future. States that are most impacted by this problem, as well as related issues like high youth poverty rates, widespread drug use and low test scores, need a wake-up call to invest more into improving conditions for young residents. Otherwise, the future economic and social progress of the state is in danger.”
Chip Lupo, WalletHub Analyst
The full findings are set out below.
The full ranking
All 51 places, ranked from most to least at-risk
| Overall RankStateTotal ScoreEducation & Employment RankHealth Rank | ||||
| 1 | Louisiana | 64.04 | 2 | 10 |
| 2 | Arkansas | 60.38 | 7 | 6 |
| 3 | Oklahoma | 60.18 | 8 | 7 |
| 4 | New Mexico | 59.72 | 3 | 15 |
| 5 | West Virginia | 59.60 | 9 | 5 |
| 6 | Oregon | 59.29 | 13 | 2 |
| 7 | Nevada | 56.12 | 5 | 22 |
| 8 | Mississippi | 55.07 | 1 | 48 |
| 9 | District of Columbia | 55.05 | 4 | 26 |
| 10 | Alabama | 54.23 | 10 | 14 |
| 11 | Alaska | 53.10 | 6 | 34 |
| 12 | Montana | 53.08 | 33 | 1 |
| 13 | Tennessee | 52.59 | 15 | 11 |
| 14 | Delaware | 50.22 | 21 | 9 |
| 15 | Texas | 48.19 | 12 | 32 |
| 16 | Arizona | 47.96 | 18 | 21 |
| 17 | Kentucky | 47.64 | 16 | 24 |
| 18 | Ohio | 46.26 | 22 | 18 |
| 19 | Missouri | 46.21 | 25 | 13 |
| 20 | Georgia | 45.95 | 11 | 43 |
| 21 | Indiana | 45.80 | 23 | 19 |
| 22 | Washington | 45.24 | 27 | 17 |
| 23 | Maine | 44.80 | 45 | 3 |
| 24 | South Carolina | 44.09 | 14 | 46 |
| 25 | Michigan | 43.76 | 26 | 23 |
| 26 | Idaho | 42.11 | 20 | 37 |
| 27 | South Dakota | 41.81 | 17 | 45 |
| 28 | Florida | 41.75 | 19 | 44 |
| 29 | Kansas | 41.49 | 29 | 29 |
| 30 | Wyoming | 41.07 | 31 | 27 |
| 31 | Pennsylvania | 40.81 | 37 | 16 |
| 32 | Vermont | 39.75 | 46 | 8 |
| 33 | Rhode Island | 38.87 | 43 | 12 |
| 34 | Virginia | 38.42 | 35 | 35 |
| 35 | Wisconsin | 38.22 | 41 | 20 |
| 36 | New York | 38.06 | 24 | 47 |
| 37 | California | 37.94 | 30 | 39 |
| 38 | North Carolina | 37.65 | 32 | 40 |
| 39 | Illinois | 36.96 | 39 | 28 |
| 40 | Colorado | 36.78 | 38 | 33 |
| 41 | Maryland | 36.35 | 34 | 42 |
| 42 | Minnesota | 33.97 | 47 | 25 |
| 43 | Nebraska | 33.78 | 40 | 38 |
| 44 | Iowa | 32.37 | 42 | 36 |
| 45 | North Dakota | 31.96 | 49 | 31 |
| 46 | Hawaii | 31.78 | 28 | 51 |
| 47 | Utah | 31.57 | 36 | 49 |
| 48 | New Hampshire | 31.41 | 51 | 4 |
| 49 | Connecticut | 29.27 | 50 | 30 |
| 50 | Massachusetts | 29.19 | 48 | 41 |
| 51 | New Jersey | 24.00 | 44 | 50 |
With the exception of Total Score, the columns show that state’s relative rank for the metric category, where 1 represents the worst conditions.
Where the gaps are widest
Each indicator was ranked separately. These are the states at either end of seven of them, with the spread between the best and worst performer.
% of Disconnected Youth
| HighestLowest | |
| T-1. Louisiana | 47. Minnesota |
| T-1. Mississippi | 48. Massachusetts |
| T-1. Nevada | 49. Rhode Island |
| 4. Arkansas | 50. North Dakota |
| T-5. Alaska | 51. New Hampshire |
| T-5. West Virginia |
Best state vs. worst state: 3x difference — Louisiana vs. New Hampshire
% of Youth Without a High School Diploma
| HighestLowest | |
| 1. New Mexico | T-46. Massachusetts |
| 2. Oklahoma | T-46. Virginia |
| 3. South Dakota | 48. New Hampshire |
| 4. Georgia | 49. Connecticut |
| 5. Arizona | 50. District of Columbia |
| 51. Hawaii |
Best state vs. worst state: 2x difference — New Mexico vs. Hawaii
% of Overweight & Obese Youth
| HighestLowest | |
| 1. Arkansas | 47. New Jersey |
| 2. West Virginia | 48. Utah |
| 3. Alabama | 49. District of Columbia |
| 4. New Mexico | 50. Colorado |
| 5. Arizona | 51. Massachusetts |
Best state vs. worst state: 2x difference — Arkansas vs. Massachusetts
% of Youth Drug Users
| HighestLowest | |
| 1. Maine | 47. Texas |
| 2. Vermont | 48. Nebraska |
| 3. Montana | 49. South Dakota |
| 4. District of Columbia | 50. Utah |
| 5. Massachusetts | 51. Alabama |
Best state vs. worst state: 3x difference — Maine vs. Alabama
Youth Labor Force Participation Rate
| Lowest participationHighest participation | |
| 1. Mississippi | 44. North Dakota |
| 2. New York | 45. Utah |
| 3. New Jersey | 46. Kansas |
| 4. California | 47. Wisconsin |
| 5. Louisiana | 48. Minnesota |
Best state vs. worst state: 2x difference — Mississippi vs. Minnesota
Youth Poverty Rate
| HighestLowest | |
| 1. District of Columbia | 47. Nevada |
| 2. Louisiana | 48. Connecticut |
| 3. West Virginia | 49. Alaska |
| 4. North Dakota | 50. New Jersey |
| 5. Mississippi | 51. New Hampshire |
Best state vs. worst state: 3x difference — District of Columbia vs. New Hampshire
% of Homeless Youth
| HighestLowest | |
| T-1. Alaska | 47. Iowa |
| T-1. District of Columbia | 48. Kansas |
| T-1. New York | 49. Virginia |
| T-1. Oregon | 50. Alabama |
| 5. Washington | 51. Mississippi |
Best state vs. worst state: 32x difference — Oregon vs. Mississippi
Sources
Data used to create this ranking were collected as of June 24, 2026 from the U.S. Census Bureau, Bureau of Labor Statistics, The Nation’s Report Card, The Annie E. Casey Foundation, Centers for Disease Control and Prevention, Substance Abuse and Mental Health Services Administration, U.S. Department of Housing and Urban Development, Best Colleges, U.S. Department of Defense — The Office of People Analytics, and the National Center for Juvenile Justice.
Ranking and underlying data by WalletHub, published July 22, 2026. See the full study and methodology.