

Adam McCann, WalletHub Financial Writer
Originally published April 7, 2026 by WalletHub
Nearly every child in America is insured, but coverage and care are not the same thing. A 2026 study by WalletHub compared all fifty states and the District of Columbia on children’s health and access to care, on nutrition, physical activity and obesity, and on oral health — scoring each place out of 100.
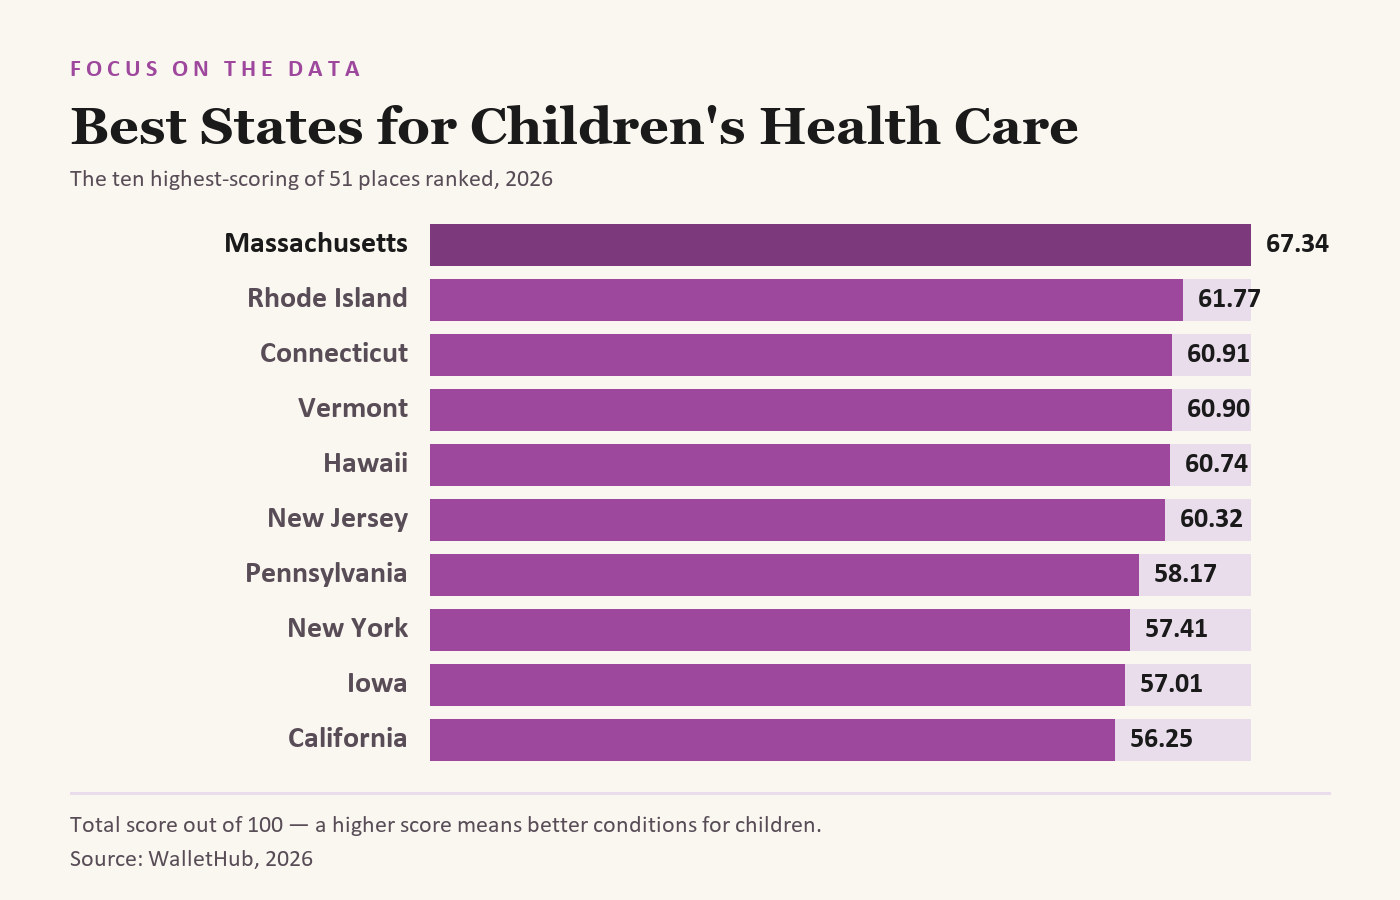
Massachusetts finishes first, followed by Rhode Island and Connecticut. Mississippi comes last. Note that this table runs the opposite way to our at-risk youth ranking: here a higher total score is better, and a rank of 1 in any column marks the best conditions, not the worst.
“Quality children’s health care should be paramount for parents choosing locations. Early access to pediatric and dental care, nutritious foods and recreation spaces enables lifelong healthy habits.”
Chip Lupo, WalletHub Analyst
The full ranking
All 51 places, ranked from best to worst for children's health care
| Overall RankStateTotal ScoreKids’ Health & Access to Health Care RankKids’ Nutrition, Physical Activity & Obesity RankKids’ Oral Health Rank | |||||
| 1 | Massachusetts | 67.34 | 1 | 1 | 45 |
| 2 | Rhode Island | 61.77 | 5 | 10 | 17 |
| 3 | Connecticut | 60.91 | 4 | 19 | 28 |
| 4 | Vermont | 60.90 | 2 | 29 | 9 |
| 5 | Hawaii | 60.74 | 3 | 26 | 32 |
| 6 | New Jersey | 60.32 | 7 | 2 | 51 |
| 7 | Pennsylvania | 58.17 | 10 | 5 | 13 |
| 8 | New York | 57.41 | 9 | 11 | 25 |
| 9 | Iowa | 57.01 | 8 | 22 | 5 |
| 10 | California | 56.25 | 11 | 13 | 34 |
| 11 | New Hampshire | 55.89 | 6 | 34 | 33 |
| 12 | Minnesota | 55.57 | 19 | 7 | 2 |
| 13 | District of Columbia | 55.48 | 12 | 23 | 7 |
| 14 | Oregon | 55.02 | 15 | 15 | 14 |
| 15 | Delaware | 55.00 | 13 | 14 | 42 |
| 16 | Colorado | 54.24 | 24 | 4 | 18 |
| 17 | Washington | 54.05 | 22 | 6 | 37 |
| 18 | Virginia | 53.98 | 14 | 28 | 16 |
| 19 | Maryland | 53.61 | 16 | 21 | 26 |
| 20 | Nebraska | 53.52 | 20 | 18 | 15 |
| 21 | North Dakota | 52.18 | 28 | 8 | 10 |
| 22 | Utah | 52.04 | 34 | 3 | 50 |
| 23 | Illinois | 51.85 | 21 | 32 | 6 |
| 24 | Florida | 51.38 | 23 | 17 | 47 |
| 25 | New Mexico | 51.30 | 26 | 25 | 3 |
| 26 | Idaho | 50.72 | 18 | 38 | 44 |
| 27 | Michigan | 50.62 | 35 | 12 | 4 |
| 28 | Maine | 49.52 | 17 | 48 | 43 |
| 29 | Kansas | 49.30 | 30 | 30 | 1 |
| 30 | Indiana | 49.12 | 33 | 24 | 39 |
| 31 | North Carolina | 48.73 | 25 | 33 | 46 |
| 32 | Wisconsin | 48.41 | 44 | 9 | 8 |
| 33 | Ohio | 47.68 | 29 | 44 | 11 |
| 34 | South Dakota | 47.66 | 32 | 35 | 36 |
| 35 | West Virginia | 46.86 | 27 | 49 | 20 |
| 36 | Tennessee | 46.76 | 31 | 45 | 29 |
| 37 | Nevada | 46.51 | 38 | 31 | 21 |
| 38 | Alabama | 45.26 | 36 | 47 | 35 |
| 39 | South Carolina | 45.13 | 40 | 39 | 22 |
| 40 | Louisiana | 45.11 | 39 | 40 | 40 |
| 41 | Missouri | 45.07 | 47 | 27 | 23 |
| 42 | Arkansas | 45.02 | 37 | 46 | 38 |
| 43 | Oklahoma | 44.72 | 41 | 37 | 48 |
| 44 | Texas | 44.63 | 48 | 20 | 31 |
| 45 | Georgia | 44.59 | 46 | 36 | 12 |
| 46 | Wyoming | 44.09 | 42 | 43 | 30 |
| 47 | Kentucky | 43.98 | 45 | 42 | 19 |
| 48 | Montana | 42.91 | 51 | 16 | 24 |
| 49 | Alaska | 42.20 | 43 | 50 | 41 |
| 50 | Arizona | 41.36 | 49 | 41 | 27 |
| 51 | Mississippi | 37.69 | 50 | 51 | 49 |
With the exception of Total Score, the columns show that state’s relative rank for the metric category, where 1 represents the best conditions.
Where the gaps are widest
Each indicator was ranked separately. These are the states at either end of nine of them, with the spread between the best and worst performer where the study reports one.
% of Children with Excellent/Very Good Health
| HighestLowest | |
| 1. New Hampshire | T-46. New York |
| 2. Idaho | T-46. New Mexico |
| 3. Nebraska | T-48. Michigan |
| 4. North Dakota | T-48. Texas |
| 5. Vermont | 50. Missouri |
| 51. Arizona |
Best state vs. worst state: 8x difference
% of Uninsured Children
| LowestHighest | |
| 1. Massachusetts | T-46. Alaska |
| 2. Vermont | T-46. Nevada |
| 3. New York | 48. Oklahoma |
| T-4. District of Columbia | 49. Arizona |
| T-4. Connecticut | 50. Wyoming |
| 51. Texas |
Best state vs. worst state: 8x difference
Infant-Death Rate
| LowestHighest | |
| 1. New Hampshire | 47. Louisiana |
| 2. Vermont | 48. Alaska |
| 3. Massachusetts | 49. Alabama |
| 4. New Jersey | 50. Arkansas |
| 5. Wyoming | 51. Mississippi |
Best state vs. worst state: 3x difference
% of Children with Unaffordable Medical Bills
| LowestHighest | |
| 1. Hawaii | 47. Utah |
| 2. Rhode Island | 48. North Dakota |
| 3. California | 49. South Carolina |
| 4. Washington | 50. Nevada |
| 5. New Mexico | 51. Wyoming |
Best state vs. worst state: 3x difference
Pediatricians & Family Doctors per Capita
| MostFewest | |
| 1. Delaware | 47. Louisiana |
| 2. Massachusetts | 48. Alabama |
| 3. Vermont | 49. West Virginia |
| 4. California | 50. Nevada |
| 5. Oregon | 51. Kansas |
% of Overweight Children
| LowestHighest | |
| 1. New Jersey | 47. South Dakota |
| 2. Idaho | 48. New Mexico |
| 3. Hawaii | 49. South Carolina |
| T-4. Utah | T-50. Arkansas |
| T-4. Indiana | T-50. Mississippi |
Best state vs. worst state: 2x difference
% of Obese Children
| LowestHighest | |
| 1. Colorado | 47. Delaware |
| 2. Massachusetts | 48. Louisiana |
| 3. Utah | 49. Arkansas |
| 4. Minnesota | 50. West Virginia |
| 5. North Dakota | 51. Mississippi |
Best state vs. worst state: 2x difference
% of Children with Excellent/Very Good Teeth
| HighestLowest | |
| 1. Massachusetts | 47. Nevada |
| 2. New Hampshire | 48. Texas |
| 3. District of Columbia | 49. Mississippi |
| 4. Vermont | 50. Missouri |
| T-5. Pennsylvania | 51. Oklahoma |
| T-5. Colorado |
% of Children with Recent Medical & Dental Checkup
| HighestLowest | |
| 1. Vermont | 47. Arkansas |
| 2. New Hampshire | 48. North Dakota |
| 3. Connecticut | 49. Florida |
| 4. District of Columbia | 50. Nevada |
| 5. Maine | 51. Mississippi |
Sources
Data used to create this ranking were collected as of March 10, 2026 from the U.S. Census Bureau, Bureau of Labor Statistics, Child and Adolescent Health Measurement Initiative, Centers for Disease Control and Prevention, Council for Community and Economic Research, U.S. Department of Agriculture, American Dental Association, Trust for America’s Health, Free Dental Care, The Annie E. Casey Foundation, Healthy Grid and U.S. News & World Report.
Ranking and underlying data by WalletHub, published April 7, 2026. See the full study and methodology.